11 Citing Figures, Tables & Sections
When you’re writing a report, you often refer to a table or figure in text.
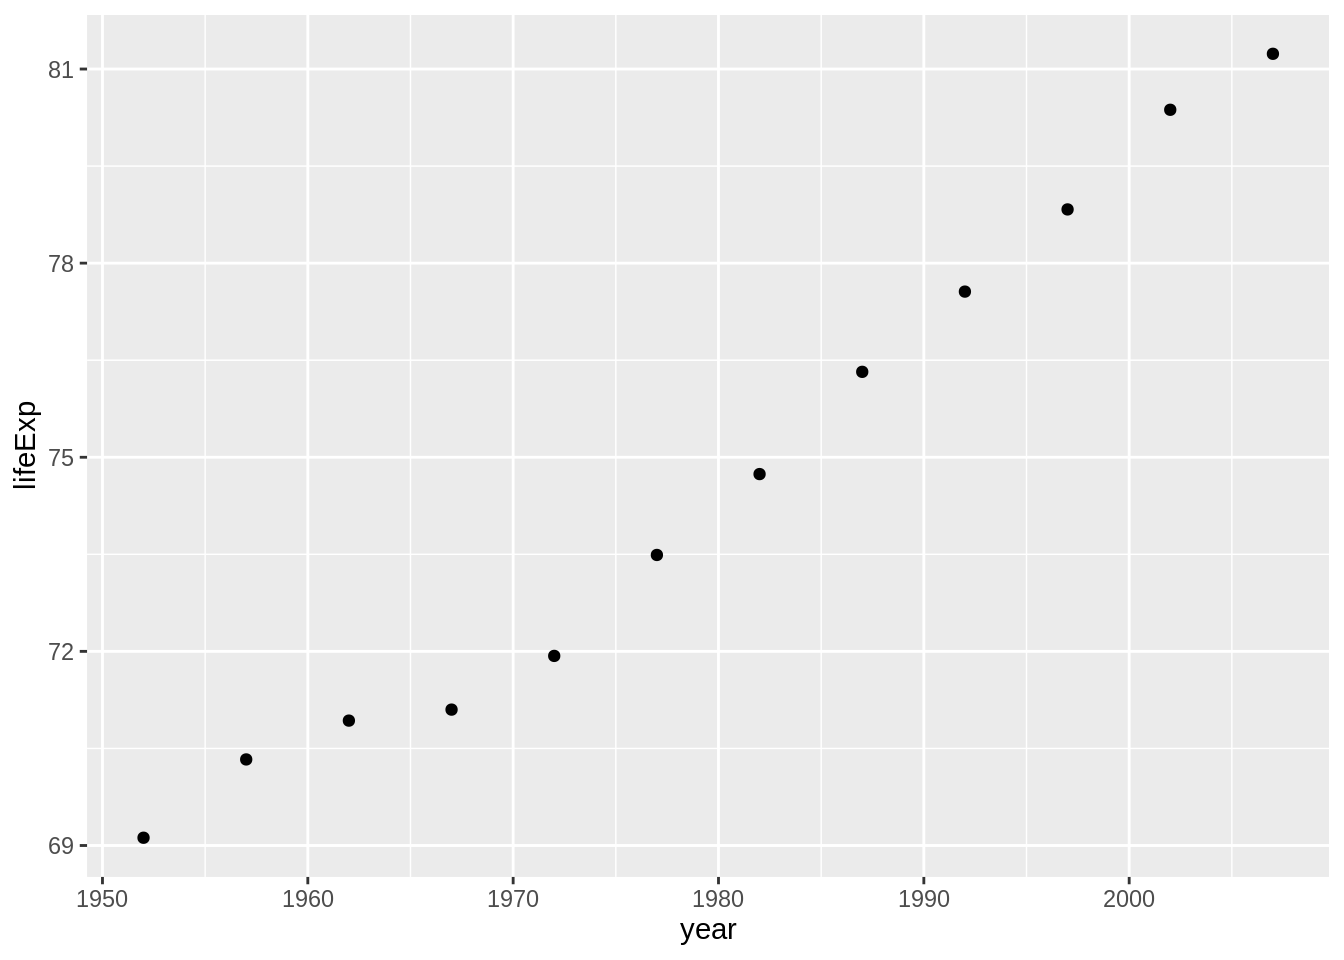
Australia’s life expectancy has increased a great deal over the past 50 years (Figure 1)
Figure 1. Life expectancy from 1952 - 2007 for Australia. Life expectancy increases steadily except from 1962 to 1969. We can safely say that our life expectancy is higher than it has ever been!
And sure, this is figure 1…for now.
But what happens if actually, that figure should be moved later in the paper?
You need to do the following:
- Update the reference to figure 1 in the text.
- Update the figure 1 caption to not say figure 1.
This is fine.
Once.
But it is never once. After this, it is frustrating, and error prone.
There is a way to solve this, using figure citations, which this lesson discusses.
11.1 Overview
- Teaching 10 minutes
- Exercises 15 minutes
11.2 Questions
- How do I refer to the table or figure in text and link to it?
11.3 Objectives
- Link to tables or figures in text.
11.4 How to refer to tables and figures in text? (demo)
- Tables are referenced in text with
@tbl-label(e.g.,@tbl-gapminder) - Figures are references in text with
@fig-label(e.g.,@git-gapminder)
Importantly here, for these two above examples to work, the things that they are referring to must have the exact label tbl-label and fig-label, respectively. That is, they must have the tbl or the fig part in there!
So, in order to use this referencing style, you must use specific labelling of your code chunks. For example, if you have some code like this:
```{r}
#| label: example-figure
image(volcano)
```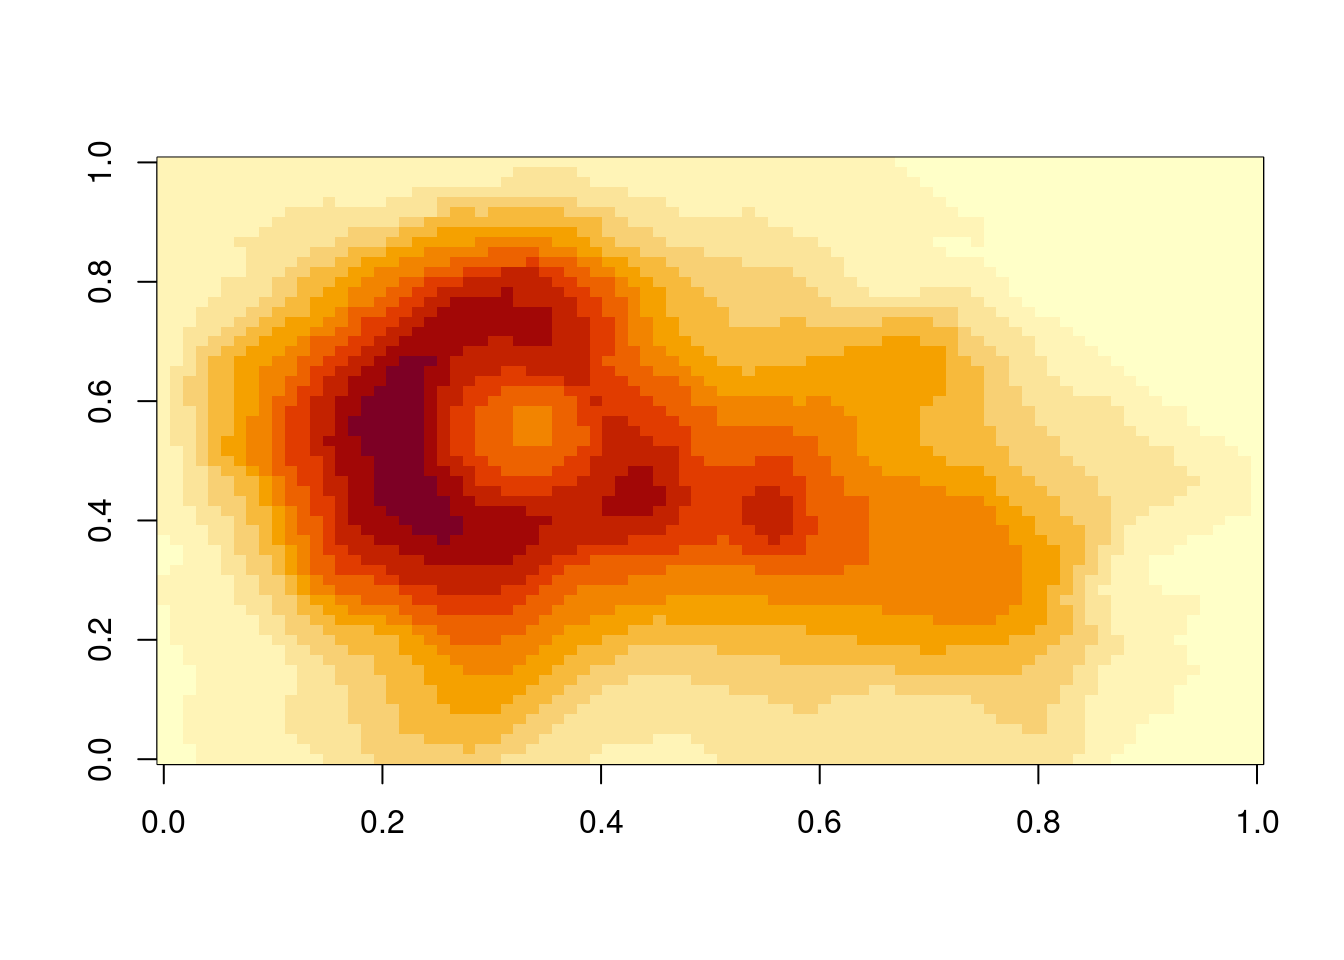
Then you cannot reference this figure in text - @example-figure does not work: (example-figure?). We get the error: “example-figure?”.
It would need to have a label like:
```{r}
#| label: fig-example
image(volcano)
```
Then you can reference it with: @fig-example - Figure 11.1.
TipHover your mouse on a reference!
Note the awesome on-hover behaviour for hovering over a reference!
Also note that there are a variety of ways to specify the figure:
@fig-example: Figure 11.1@Fig-example: Figure 11.1[Fig @fig-example]: Fig 11.1-@fig-example: Figure 11.1
(reference here: https://quarto.org/docs/authoring/cross-references.html#references)
NoteYour Turn
- Using “03-qmd-lm-tables-inline-qmd”
- Convert your output to use
figprefixes to reference figures
- Convert your output to use
TipDemo
```{r}
#| label: fig-gg-oz
#| fig-cap: Life expectancy from 1952 - 2007 for Australia. Life expectancy increases
#|   steadily except from 1962 to 1969. We can safely say our life expectancy is
#|   higher than it has ever been!
library(ggplot2)
library(dplyr)
gapminder %>%
  filter(country == "Australia") %>%
  ggplot(aes(x = year,
             y = lifeExp)) +
  geom_point()
```
Australia’s life expectancy has increased a great deal over the past 50 years (See Figure 11.2).
NoteYour Turn
- Using “03-qmd-lm-tables-inline-qmd”:
- Add a new plot in your document and reference it
11.5 Referencing a table
To cite a table, you write the following:
@tbl-chunk-name
```{r}
#| label: tbl-gg-oz-tab
gapminder %>%
  filter(country == "Australia") %>%
  knitr::kable(caption = "Raw gapminder data for Australia.")
```| country | continent | year | lifeExp | pop | gdpPercap |
|---|---|---|---|---|---|
| Australia | Oceania | 1952 | 69.120 | 8691212 | 10039.60 |
| Australia | Oceania | 1957 | 70.330 | 9712569 | 10949.65 |
| Australia | Oceania | 1962 | 70.930 | 10794968 | 12217.23 |
| Australia | Oceania | 1967 | 71.100 | 11872264 | 14526.12 |
| Australia | Oceania | 1972 | 71.930 | 13177000 | 16788.63 |
| Australia | Oceania | 1977 | 73.490 | 14074100 | 18334.20 |
| Australia | Oceania | 1982 | 74.740 | 15184200 | 19477.01 |
| Australia | Oceania | 1987 | 76.320 | 16257249 | 21888.89 |
| Australia | Oceania | 1992 | 77.560 | 17481977 | 23424.77 |
| Australia | Oceania | 1997 | 78.830 | 18565243 | 26997.94 |
| Australia | Oceania | 2002 | 80.370 | 19546792 | 30687.75 |
| Australia | Oceania | 2007 | 81.235 | 20434176 | 34435.37 |
See above in Table 11.1.
If you want to move the caption location you can use tbl-cap-location: <position> to specify the location. By default it is the top.
```{r}
#| label: tbl-gg-oz-tab-bottom
#| tbl-cap-location: bottom
gapminder %>%
  filter(country == "Australia") %>%
  knitr::kable(caption = "Raw gapminder data for Australia.")
```| country | continent | year | lifeExp | pop | gdpPercap |
|---|---|---|---|---|---|
| Australia | Oceania | 1952 | 69.120 | 8691212 | 10039.60 |
| Australia | Oceania | 1957 | 70.330 | 9712569 | 10949.65 |
| Australia | Oceania | 1962 | 70.930 | 10794968 | 12217.23 |
| Australia | Oceania | 1967 | 71.100 | 11872264 | 14526.12 |
| Australia | Oceania | 1972 | 71.930 | 13177000 | 16788.63 |
| Australia | Oceania | 1977 | 73.490 | 14074100 | 18334.20 |
| Australia | Oceania | 1982 | 74.740 | 15184200 | 19477.01 |
| Australia | Oceania | 1987 | 76.320 | 16257249 | 21888.89 |
| Australia | Oceania | 1992 | 77.560 | 17481977 | 23424.77 |
| Australia | Oceania | 1997 | 78.830 | 18565243 | 26997.94 |
| Australia | Oceania | 2002 | 80.370 | 19546792 | 30687.75 |
| Australia | Oceania | 2007 | 81.235 | 20434176 | 34435.37 |
Reference: https://quarto.org/docs/authoring/cross-references.html#tables and https://quarto.org/docs/authoring/tables.html#caption-location
11.6 Other things you can cross/reference
You can also reference theorems, code, proofs, and equations! See https://quarto.org/docs/authoring/cross-references.html#theorems-and-proofs for more details.
NoteYour Turn
- Using “03-qmd-lm-tables-inline-qmd”
- Create a table in your document and refer to it in text
11.7 Referencing a section
You can even reference a section in your report: @sec-slug
However, in order to write this, you need to include sec-slug in your markdown header, like so:
## your amazing header {#sec-slug}You must also include number-section in your YAML:
---
title: "example"
number-sections: true
---
For example, I can refer to the first section (Section Chapter 11) in this document by referring to the section as
(Section @sec-start)
because it was written as:
# Citing Figures, Tables & Sections {#sec-start}
TipDemo: Using visual mode
Visual mode is this pretty neat feature, it’s best demonstrated live!
NoteYour Turn
- Using “03-qmd-lm-tables-inline-qmd”
- Reference a section in the report.
- Open up “04-qmd-global-opts-device.qmd” and work through the tasks there